


 English
Trends in Modal Analysis: Visualization in Google Earth
Could you ever imagine the visualization of Interarea Oscillations in Google Earth? Now it is possible thanks to the DIgSILENT PowerFactory API, much more powerful in version 2016.
Beginning with PowerFactory 2016, the Application Programming Interface (API) has been decoupled from the PowerFactory version. This means, the interface now remains stable across different PowerFactory versions. It is no longer required for third party applications to be re-compiled for specific versions. Beyond that, API has been extended so that all scripting functions can now be used. Applications which were created before PowerFactory 2016 will need just a few minor adaptations to make use of this new compatibility feature.
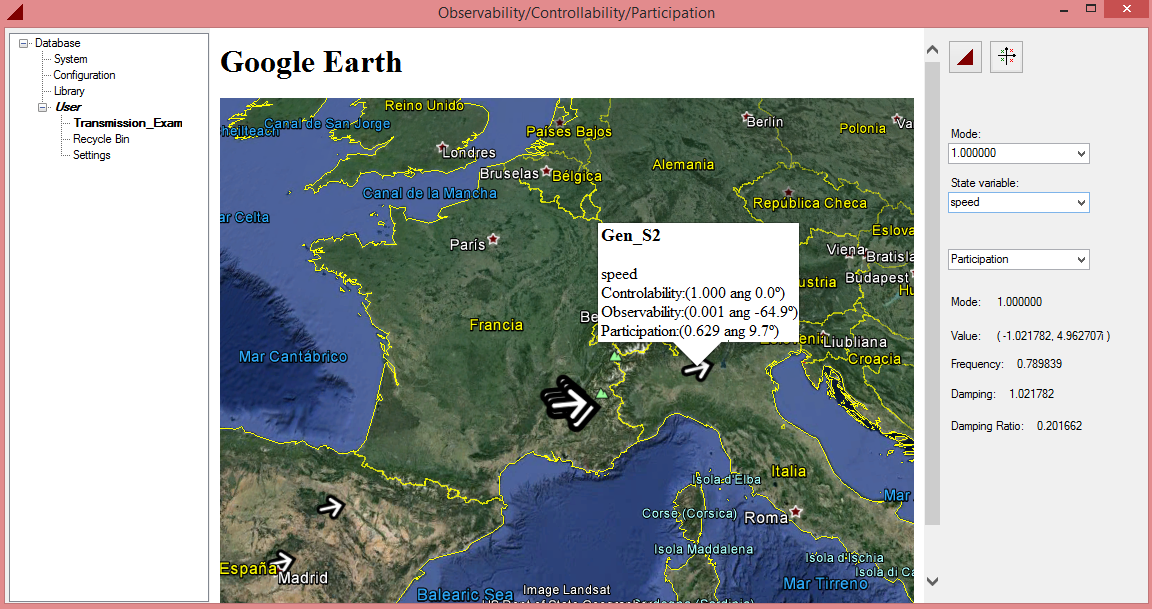
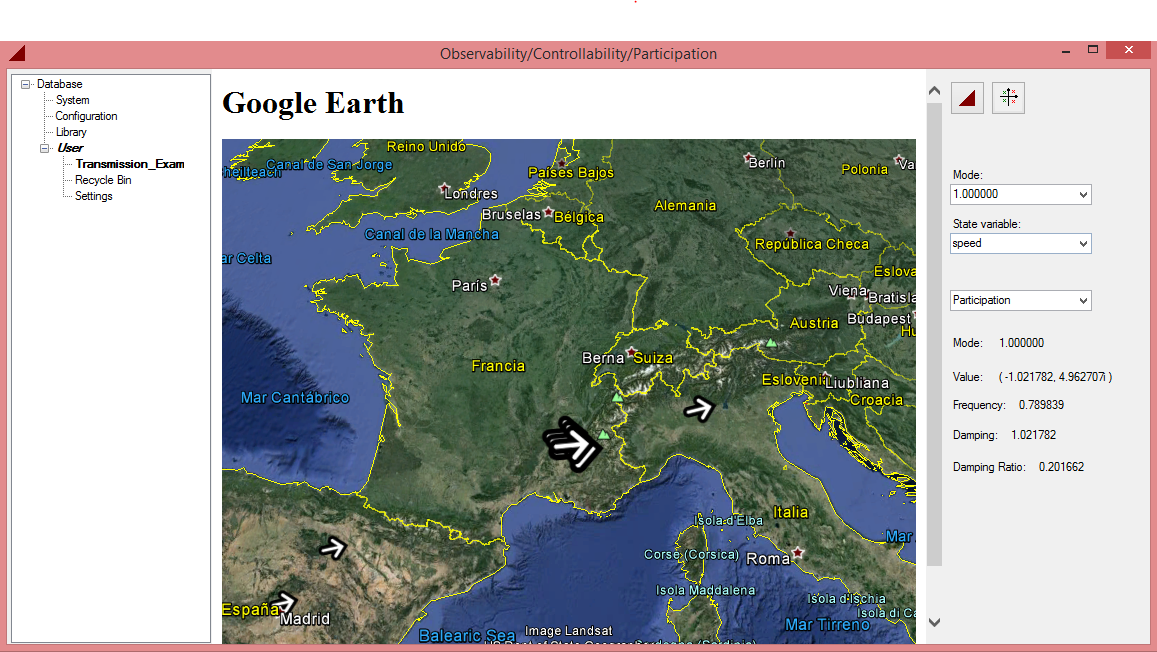
DIgSILENT Ibérica has developed a user-friendly interface to visualize modal analysis results in Google Earth. The controllability, the observability and the participation factor of the recorded state variables for each mode and synchronous generator in the project can be displayed on the map. Results are displayed as a vector where its size depends on the magnitude and its orientation depends on the angle. The location of every vector in the map is given by the GPS coordinates of the elements in the network.
The interface is very friendly:
- Plugin control representing the PowerFactory database tree of the connected user. A context menu allows activating/deactivating projects.
- The Google Earth window, based on a web browser and Google Earth Java Script API.
- One button to show/hide PowerFactory Main window (PowerFactory is running as an engine)
- One button to launch the Modal Analysis. The obtained results are post-processed in order to display the final results in kml format.
- Several combo boxes to select the displayed results. The balloon help is used to give detailed results of the corresponding generator.
The possibilities of the API are unlimited! Have you ever had an API-IDEA? Do not hesitate to share your API-IDEA with us through the social media and…
…enjoy!